Introduction
This a placeholder post. For reasons that are too lengthy to go into, I been drawing some molecules this week. Naturally, I thought of TikZ. In the process, I discovered the package Chemfig, which looks absolutely fantastic. But that’s for “proper” molecule diagrams, I wanted more “ball and stick” ones and there isn’t a package for that. So I started doing it by hand.
In chat, I was showing off some of the diagrams that I’d managed to produce. One of them was a buckyball. Jake asked if there was anything in it that was worth a question. I had to admit that it was produced by a mess of scripts and hacks and then just changing stuff at the end, so nothing special to report.
But I did have a few ideas on how to do it properly. I don’t have the time right now to put them together and sort out the messy bits. So I’m going to write down my ideas here so that I don’t lose them. Also, others might have ideas on how to improve it. Indeed, someone might just decide to write the package themselves.
What I Did
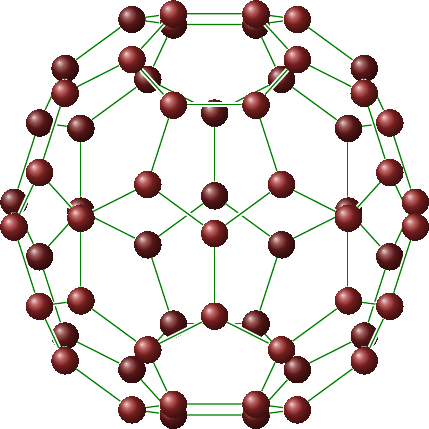
The idea is to draw a “ball and stick” molecule. The balls represent the atoms in a molecule and the sticks are the bonds. The key is that it should look truly three dimensional. This means sorting out which things are in front of others and drawing them in the right order. For the buckyball, I used a perl script to sort the atoms. Then I split them in to “back” and “front”. I drew the back ones first, then drew the bonds, and finally the front ones. To get the bonds right, I actually drew the front molecules in the first round but invisibly.
Here’s the resulting picture:

(You really, really do not want to see the code for that.)
After Jake’s question in chat, I wondered how much of what I did would be implementable in (La)TeX. I actually think almost all of it. Here’s what I did:
- Found a list of the coordinates of the vertices on Wikipedia.
-
Cut-and-pasted them and parsed them through a script to actually generate the coordinates (this is because they were of the form (±1, 0, ±3ϕ) so I needed to generate all the possibilities and replace ϕ by its value).
-
Ordered the vertices by “height” (along some vector that I chose).
-
Generated the list of edges. To do this, I computed the distances between each pair of vertices and for each vertex chose the three closest vertices to link to.
-
After that, I put it in to the LaTeX document, split the nodes into the “front” and “back” group, rendered the picture, and then tweaked the groupings a little until I felt it looked “right”.
Most of that should be doable by TeX. The question is: can it be done easily? The big hurdle is a sorting routine. Fortunately, a quick peek in the LaTeX3 documentation revealed a quicksort algorithm. Knowing that that exists, I feel that the rest is at least feasible.
Designing the Problem
It’s important to frame the problem. I want to draw a “molecule”. To be precise, I want to draw a “ball and stick” diagram of a molecule. This consists of a list of atoms with some of them joined together by bonds. The atoms should look like balls, and the bonds like lines. We want to draw the atoms and bonds in a way to show their three dimensionality. Since TikZ is inherently two dimensional, the simplest way to do this is to draw them in the right order.
So clearing away all the extra garbage, we have a list of points and a list of lines between some of those points (though I’ll suggest a modification of that in a moment). The points are given by 3d coordinates. We’ll render the points as circles filled using the “ball” shading to make them look a bit three dimensional. We want to draw the points and lines in the right order so that things in front are drawn after things behind.
One additional thing is that the default 3d-to-2d of TikZ is a bit crude. It would be nice to be able to use a different routine, maybe a perspective projection.
Ideas on Implementation
Drawing the points is simple enough. We simply order them according to some notion of “in front” and “behind”. Using LaTeX3’s quicksort makes this easy as one can define a comparison routine. Then simply draw them in the correct order.
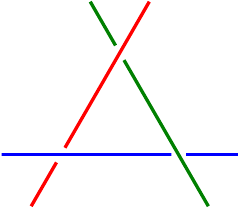
The difficulty is in drawing the lines. It simply is not possible to order the lines according to which is in front. It is possible to take two lines and decide which should be drawn first, but this does not define a partial order on the set of lines as it is not transitive. Here’s the simple example:

But the way that I drew that also suggests the solution. To draw that, I put nodes at the intersections and drew the lines via the nodes. When doing this, the path “skips” the node, thus introducing a break.
Thus for each pair of lines, the routine would have to work out which one was “on top” from the point of view of the viewer (which might not be a simple projection) and work out where along the line that intersection lies. Then it doesn’t matter what order the lines are drawn.
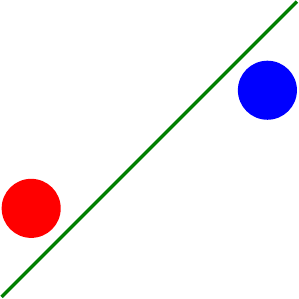
We need to do the same with the lines and the points. Again, it isn’t possible to interleve the nodes and lines so that they are drawn in the correct order. The following diagram represents the side view and we can see that as far as the points are concerned, the red point should be drawn first and then the blue. But when the line is taken into account, the blue point is behind the line and the red line in front.

So for each line, we need to compare it with every other line and every point, decide whether there is an overlap, take a note of the place an overlap happens, and then when we draw the line we break it at these points using nodes.
There are several things which need to be take into account here. The “points” are not just points, they will be circles. So the intersection of a point and a line is not that simple. The lines can probably be considered to have no thickness. If a line has two breakpoints too near to each other then they should be subsumed into one, otherwise it will look a bit odd:

Conclusion
This would be quite a nice feature to have, as it would give an ability to draw simple 3d diagrams without the user having to worry about getting the three dimensionality correct. The general case of 3d diagrams is complicated, but with this simplified set-up, it may be possible. However, it’s still too complicated for me at the moment! Hence this post: a list of my thoughts so far, and a vague hope that someone will come along and do it for me.
I’ve been using (Gene Ressler’s) sketch in order to produce similar figures. Its much easier than the method used to generate the buckyball. It does still require some knowledge of the 3d coordinates.
Did you look at asymptote? It is supposed to have the capability of drawing 3D graphics.
I’ve not looked at any external tools for drawing this sort of thing. The difficulty with them is that I don’t often have to do these kinds of diagrams so learning a whole new program just for them doesn’t actually save me much time. As for the buckyball code, actually it was very easy to produce. There were some easy perl scripts to sort out the order for the nodes and even to decide which edges to draw (so I didn’t have to specify them by hand). They even took their input directly from the Wikipedia page and generated all of the coordinates. I haven’t looked, but I doubt that Sketch could do it any easier unless it happened to have the buckyball programmed in. The problem with that method is that it doesn’t easily generalise.
Having said that, I’ll take a look at both of the suggestions.
I really appreciate to read things on the creative process when it comes to TeX and friends. As a relative newcomer I’ve found it hard to understand how people reason when tackling problems.